Summary: We’re often asked why Virtjoule HVAC vibration sensors report on a one-second interval. Why not five minutes or even longer? This article will cover an actual fault case we discovered on a customer site and demonstrate why a one-second update interval is beneficial for diagnosing HVAC problems such as short-cycling.
Key concepts: HVAC vibration analysis techniques, HVAC sensor reporting intervals, signal aliasing, HVAC short-cycling.
It’s fairly common to find short-cycling HVAC units, especially after we first install the Virtjoule sensor system. They’re easy to see visually in the Virtjoule web application by looking at the sparklines for the building’s HVAC sensors. The following is a typical sparkline of a short-cycling HVAC unit – it’s almost solidly filled with lines going from off to on and back to off:

Graph of Short cycling HVAC Unit
A more typical HVAC cycling pattern is shown in this sparkline:

Graph of regular cycling HVAC Unit
The reason I’m using sparklines above is mainly to illustrate that the short cycling problem stands out from the visual contrast of these two graphs without regard to the actual timing of the cycle. However, the reason it can stand out in such a simple way is because of a fairly rapid reporting interval by the sensors.
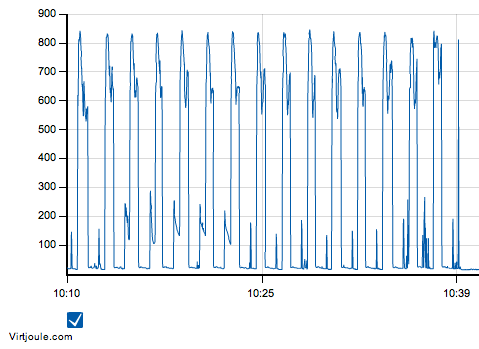
Here’s the short-cycling graph in a bit more detail – this represents about a 12 hour period of time.

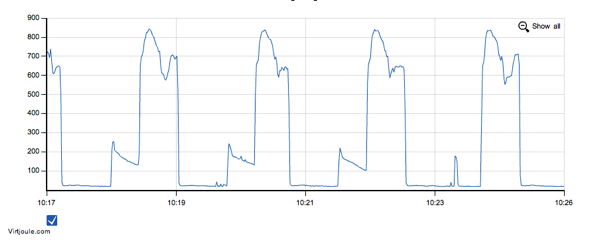
Zooming in more closely, you can see the actual short-cycling wave form begin to take shape along with more detail with respect to the period of short cycling.

Another zoom level deeper:

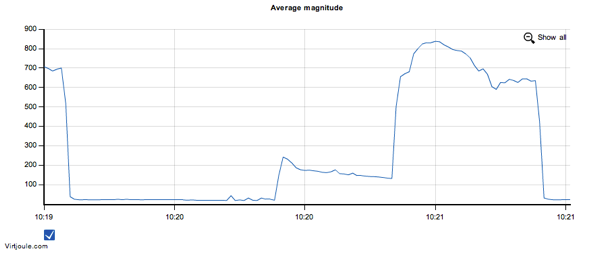
And finally, a zoom level of the short-cycling waveform focusing on a single period or cycle of the HVAC unit. From this, it’s easy to see the entire short cycling period is about two minutes. Moreover, you can see the “click” of the HVAC unit attempting to turn on the condenser fan at about mid-way through the 10:20 mark. The fan failed to start and a bit later, the compressors kicked on and shortly turned off, potentially due to a high head-pressure fault in the system which protects itself by shutting down the compressor.

Virtjoule-Sense sensors sample the vibrations from the HVAC unit nearly 10,000 times per second and report the average magnitude of the data over that one-second period. If we sampled data once every minute or two minutes, we could easily miss short-cycling events such as those captured above.
A sampling period of 2 minutes could leave you believing the unit is running non-stop if the sample period happened to fall on the regular peak shown in this real-world example. Or alternatively, a 2-minute sample could leave you believing the unit never ran at all if it happened to sample on the interval when the unit was not running between peaks.
Finally, the world is never so punctual, so the more likely scenario of sampling on a 2 minute interval is that you would see a mix of highs and lows which would show inaccurate, sporadic run time.
Using a one-second reporting interval, it’s possible to quickly capture subtle state changes in HVAC equipment and also form a very accurate picture of what’s happening within the unit.
Each HVAC unit will have a somewhat different acoustic signature when you get down to the small details of the waveform, but the overall picture of HVAC short-cycling, built on one second data, becomes very clear.
[Landon Cox - VP of Embedded Engineering, Virtjoule - is the hardware designer for Virtjoule Sense sensors. You may contact Landon at: landon at virtjoule dot com]


|